Developer Behavioral Analysis From Real Data
TL;DR: We ran a behavioral analysis on a single developer using one week of real production data. 29 AI sessions, 20+ PRs opened, 12 merged, $70.39 in AI spend. The report surfaced things no standup ever would: 2 AM coding sessions across parallel repos, a production hotfix shipped in 4 minutes flat, deliberate model selection between Haiku and Sonnet depending on task complexity. This is what developer behavioral analysis looks like when it’s built on actual data instead of opinions.
Performance reviews are broken. Everyone knows it. Managers write them based on what they remember (or what stood out). Developers fill in self-assessments that read like LinkedIn posts. The result is a document that tells you almost nothing about how someone actually works.
What if you could build a developer profile from real behavioral data instead?
What a developer behavioral analysis actually looks like
We generated a behavioral report for a single developer. One week of data. Here’s what Cogniscape surfaced:
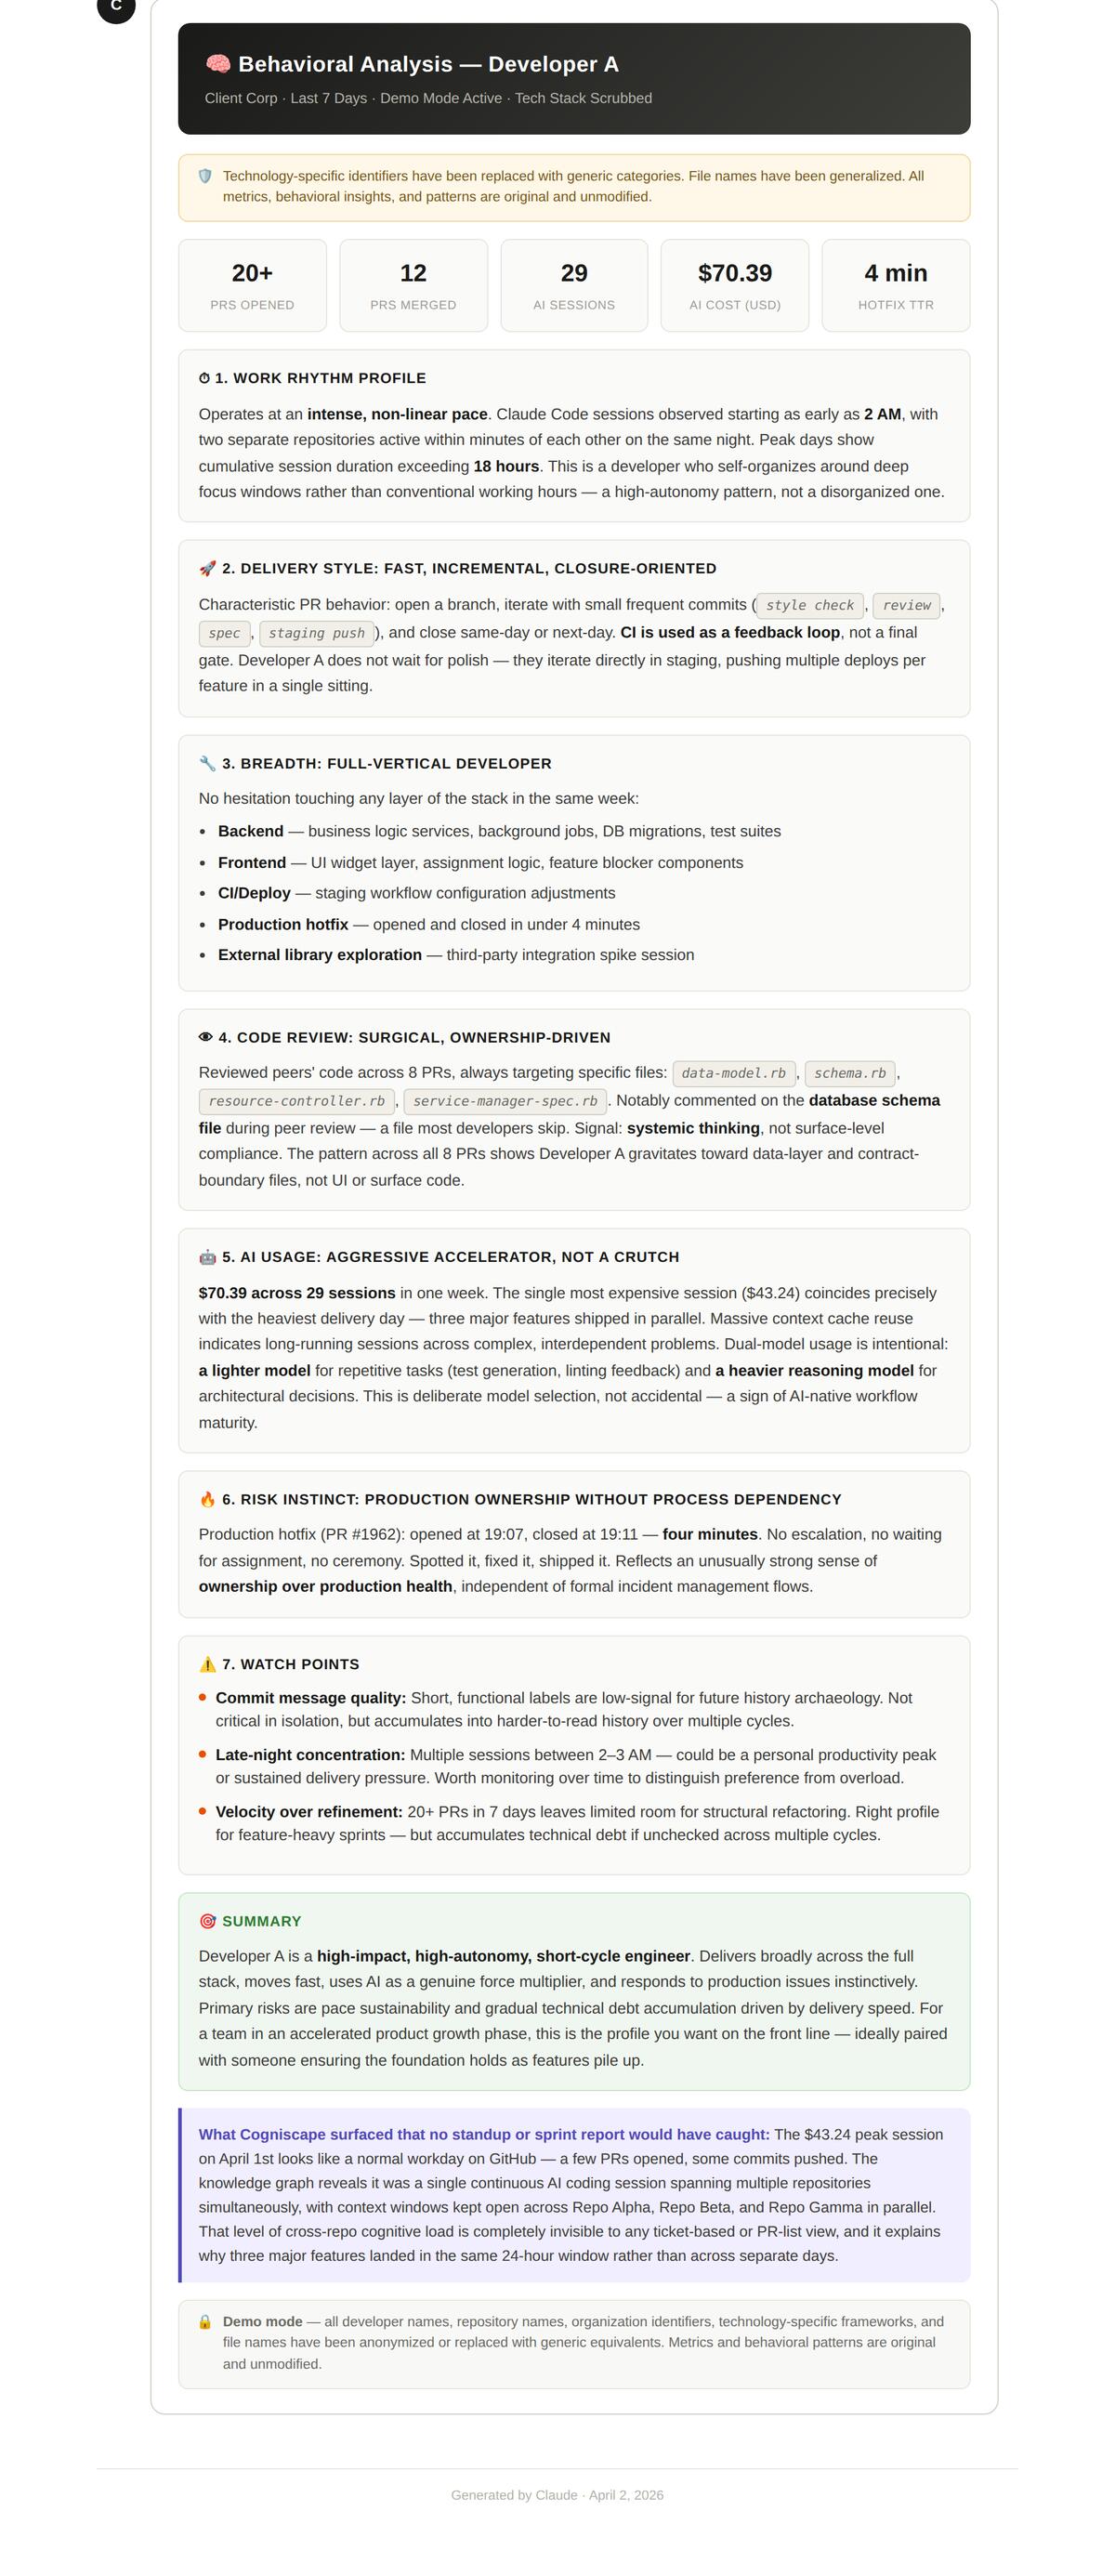 Click to view full size. Real production data, anonymized. Generated by Cogniscape.
The headline numbers: 20+ PRs opened, 12 merged, 29 AI sessions, $70.39 in total AI cost, and a 4-minute hotfix time-to-resolution. But the numbers alone aren’t the point. The behavioral patterns behind them are.
Work rhythm: intense, non-linear, autonomous
This developer doesn’t follow a 9-to-5 schedule. Claude Code sessions were observed starting as early as 2 AM, with two separate repositories active within minutes of each other. Peak days show cumulative session duration exceeding 18 hours.
That sounds alarming if you’re thinking in terms of “work-life balance compliance.” But the behavioral data tells a different story. This isn’t someone grinding through tickets. It’s someone who self-organizes around deep focus windows. The pattern is high-autonomy, not chaotic.
A traditional standup would never surface this. You’d hear “I worked on the widget and pushed a few PRs.” The behavioral analysis shows a developer operating in intense, concentrated bursts across multiple repos simultaneously.
Delivery style: fast, incremental, closure-oriented
The delivery pattern is clear: open a branch, commit small focused improvements, merge quickly. CI is used as a feedback loop, not a final gate. This developer doesn’t wait for polish. They iterate directly in staging, pushing multiple deploys per feature in a single sitting.
For teams in accelerated product growth, this is exactly the delivery cadence you want. For teams focused on stability and process compliance, it’s a risk factor. Neither judgment is wrong. But you can’t make either one without seeing the pattern first.
Full vertical developer: no layer is off-limits
One of the most valuable findings in the behavioral analysis was the developer’s cross-stack versatility. In a single week, they touched:
- Backend: serverless functions, resources, background jobs, SDK integration, specs
- Frontend: widget UI, component logic, blocker states
- CI/Deploy: staging and runtime configuration adjustments
- Production hotfix: opened and closed in under 4 minutes
- External library exploration: desktop framework research session
No bottleneck at any layer. This is someone who can move a feature from backend to frontend to deployment without waiting on anyone else. That kind of versatility is extremely hard to identify in a traditional review. You’d need to manually trace PRs across repos and connect them. The behavioral analysis does it automatically.
AI usage: accelerator, not a crutch
Here’s where it gets really interesting. $70.39 across 29 sessions in one week. The most expensive single session ($43.26) correlates precisely with the heaviest delivery day, when three major features shipped in parallel.
The model selection is deliberate: Claude Haiku for repetitive tasks like plans and string operations. Claude Sonnet 4.6 for architectural reasoning. This isn’t someone blindly using the most expensive model for everything. It’s intentional tool selection based on task complexity.
The AI is being used for orchestration-style work, not to generate code. That’s a meaningful behavioral signal. It tells you this developer understands what AI is good at and deploys it accordingly. Compare that to a developer who burns through Opus tokens on tasks that Haiku could handle. Same spend, completely different AI investment ROI.
The risk the data surfaced
Behavioral analysis isn’t just about strengths. The report flagged a specific risk: instinct-driven production deployment without process dependency.
A production hotfix PR was opened at 10:51 and closed at 10:55. Four minutes. No escalation, no waiting for assignees, no commenting. Spotted it, fixed it, shipped it.
That reflects an unusually strong sense of ownership over production health. It also means this developer operates independently of formal incident management flows. If the fix had been wrong, there was no safety net.
This is the kind of finding that transforms a performance conversation. Instead of vague feedback like “be more careful with production deploys,” you can point to a specific incident and discuss the tradeoff between speed and process. Evidence, not opinion.
Watch points: what the behavioral data flags
The report also surfaced three areas worth monitoring:
-
Commit message quality. Labels like
fix_ci,spec,recLineare too terse for future archaeology. Acceptable during a sprint, but they accumulate into an unreadable git history over time. -
Late-night concentration. Multiple sessions between 2-3 AM. Could be a personal productivity peak. Could be a sustainability concern. The data doesn’t judge, but it surfaces the pattern for someone to evaluate.
-
Velocity over refinement. 20+ PRs in 7 days leaves limited room for structural rethinking. This is the right profile for feature sprints. But if unchecked across multiple cycles, it accumulates technical debt.
None of these are “problems” in isolation. They’re behavioral patterns that become risks in certain contexts. A good engineering leader uses this data to have better conversations, not to generate automated warnings.
What standups and sprint reports miss
Here’s the Cogniscape insight from the bottom of the report: the $43 peak session on April 1st looked like a normal workday on GitHub. A few PRs opened, some commits pushed. Nothing unusual.
The knowledge graph revealed something different. It was a single continuous Claude Code session spanning multiple repositories simultaneously, with context windows kept open across three repos in parallel. That level of cross-repo cognitive load is completely invisible to any ticket-based or PM tool. And it explains why three major features landed in the same 24-hour window.
This is what AI coding observability makes possible. Not just tracking what was delivered, but understanding how the work actually happened. The reasoning, the patterns, the intensity behind the output.
From data to talent intelligence
Developer behavioral analysis isn’t about surveillance. It’s about replacing opinions with evidence.
A report like this can support a performance review, a team restructuring decision, a call on who to pair with a junior developer. It can validate that someone’s unconventional work rhythm is actually highly productive. It can surface risks before they become incidents.
The $70.39 weekly AI cost for this developer is extremely favorable compared to any hired resource or FTE. But you’d only know that if you could see what that $70.39 actually produced. Session-level behavioral data makes that visible.
Want to see what this kind of analysis looks like against real development data? The live demo on our homepage lets you query actual Cogniscape data with natural language.
Try the live demo →
Start building developer behavioral profiles
Every team using AI coding tools is already generating this data. The sessions, the model choices, the delivery patterns, the risks. It’s all there. The question is whether you’re capturing it or letting it disappear when the session ends.
Cogniscape generates behavioral reports like the one above automatically. It captures session-level data from AI coding tools, correlates it with GitHub and Linear activity, and builds structured profiles that show how each developer actually works.
If you want to see what this looks like for your team, book a 30-minute briefing and we’ll walk through real behavioral analysis data from production teams. Or explore the Cogniscape documentation to understand how session-level tracking powers developer intelligence.
Developer behavioral analysis: common questions
What is developer behavioral analysis?
Developer behavioral analysis is the practice of building a structured profile of how a developer actually works, based on observable data: session patterns, delivery cadence, tool usage, code review habits, and risk behaviors. Unlike traditional performance reviews based on opinions or self-reports, behavioral analysis uses real production data to surface patterns that are invisible in standups and sprint reports.
How does AI session data improve developer behavioral analysis?
AI session data adds a layer of visibility that didn’t exist before. It shows which models a developer selects for which tasks, how they distribute spend across repositories, whether they use AI for orchestration or code generation, and how session intensity correlates with delivery outcomes. This is behavioral signal that no ticket system or Git log captures.
Can behavioral analysis replace performance reviews?
It can make them dramatically better. Traditional reviews rely on manager impressions and self-assessments. Behavioral analysis provides evidence: delivery patterns, cross-stack versatility, code review quality, risk behaviors. The data doesn’t replace judgment, but it gives the people making judgments something real to work with.
Does this require developers to change their workflow?
No. Cogniscape captures session data automatically from AI coding tools and correlates it with GitHub, Linear, and other engineering tools. Developers don’t need to tag, annotate, or log anything. The behavioral profile is built entirely from data that already exists.